correct direction, correct entry but wrong ext
Wednesday 14 December 2011
Tuesday 6 December 2011
EMAs and VST charts
Even though previous Simmings were good but am not comfortable with it as my account IS small and these charts had big frames
...So I put 3 type of charts which have very short time frame....
tested ..it feel good
...So I put 3 type of charts which have very short time frame....
tested ..it feel good
Wednesday 30 November 2011
Sim + 350
Tough market...putting back 3 ema ---see from there + macd with the sam esetinng of ema.....simple order for the mind in tough market
Thursday 24 November 2011
SIm + 380 - enter on pullbacck
Nice figure...
Since I take supplement, my brain improved a bit and I took a more " wide" approach to trading..Like a Elliot Wave...I conclude that market has 3 phases - trend, flat breakout, and swinging from point to point. The best gain . of ocurse is trend phases..but to take position in trend required a"pullback" straetgy to avoid whiplash.
Since I take supplement, my brain improved a bit and I took a more " wide" approach to trading..Like a Elliot Wave...I conclude that market has 3 phases - trend, flat breakout, and swinging from point to point. The best gain . of ocurse is trend phases..but to take position in trend required a"pullback" straetgy to avoid whiplash.
Tuesday 22 November 2011
Pullbacks
Below is an article from one excellent trading website ....
http://www.swing-trade-stocks.com/pullbacks.html
How to Trade Pullbacks
Buying weakness and selling strength is the art of buying pullbacks. Stocks that are in up trends will pull back offering a low risk buying opportunity and stocks that are in down trends will rally offering a low risk shorting opportunity.
As a swing trader, you have to WAIT for these opportunities to happen because...
Doesn't it make more sense to buy a stock after a wave of selling has occurred rather than getting caught in a sell-off?
Doesn't it make more sense to short a stock after a wave of buying has occurred rather than getting caught in a rally?
Absolutely! If you are buying a stock then you want as many sellers out of the stock before you get in. On the other hand, if you are shorting a stock, then you want as many buyers in the stock before you get in. This gives you a low risk entry that you can manage effectively.
Buying Pullbacks And Shorting Rallies
Where do you buy a pullback and where do you short a rally? You buy them and short them in the Traders Action Zone (TAZ). Here is and example on the long side: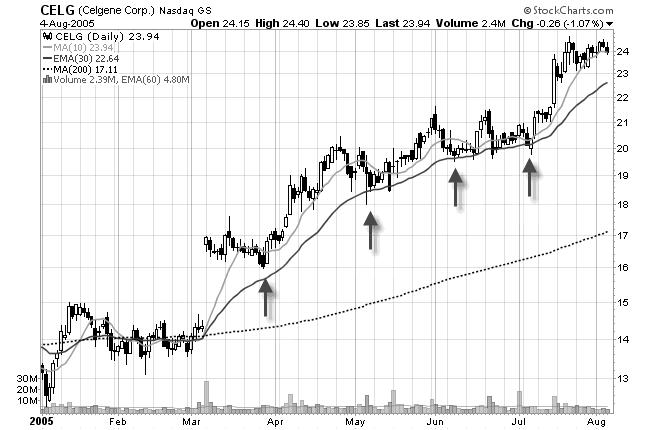 See how you are buying stocks in strong up trends after a wave of
selling has occurred? Ok, now here is an example on the short side:
See how you are buying stocks in strong up trends after a wave of
selling has occurred? Ok, now here is an example on the short side: Now you can see how you are shorting stocks after a wave of buying has occurred.
When going long, wait for the decline into the TAZ and when going short, wait for the rally into the TAZ.
Are all of them created equal? Nope. You have just a standard pullback like in the example above and then you have...
The First Pullback
These are exactly what the name implies. It is the first one after a change in trend. How do you identify a change in trend - when the 10 SMA crosses the 30 EMA. After that happens, you look for an entry when the stock gets into the TAZ. Here is an example: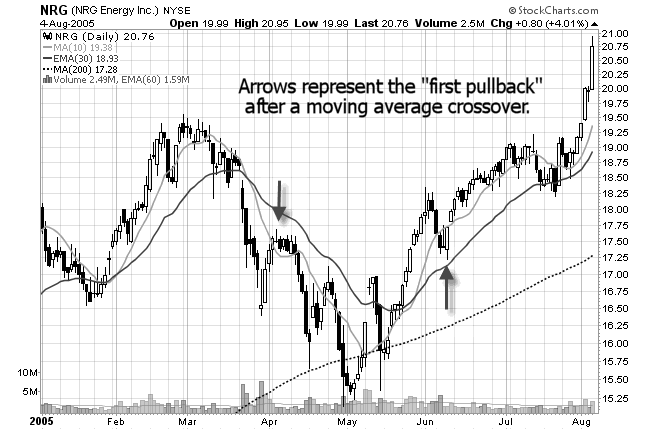 This is the most reliable type of entry into a stock and this is the
likely area where institutional money is going to come into the stock.
If you only trade one pattern, this should be it! You can get into a
stock at the beginning of a trend, at a point of low risk, and you can
take partial profits and ride the trend to completion! What more could
you ask for?
This is the most reliable type of entry into a stock and this is the
likely area where institutional money is going to come into the stock.
If you only trade one pattern, this should be it! You can get into a
stock at the beginning of a trend, at a point of low risk, and you can
take partial profits and ride the trend to completion! What more could
you ask for?Oh yeah, speaking of getting in on the beginning of a trend. This next setup fits neatly into an Elliott Wave Pattern...
First Pullback After A Breakout
There is one other type of pullback worth mentioning and that is the first pullback after a breakout.If you are looking at a stock that is trading sideways or forming a basing pattern, and it suddenly breaks out of the pattern, you can look to buy the first pullback after the breakout. This also gives you a low risk entry into a stock that will likely continue the current trend.
Here is an example:
 Most traders are going to buy break outs. The word break outs
sounds so exciting doesn't it? The problem with buying break outs is
that it is hardly every low risk. Think about it. If you are buying
stocks when everybody else is, then who is left to buy the stock after
you get in?
Most traders are going to buy break outs. The word break outs
sounds so exciting doesn't it? The problem with buying break outs is
that it is hardly every low risk. Think about it. If you are buying
stocks when everybody else is, then who is left to buy the stock after
you get in?Forget buying break outs. Step away from the crowd. Wait for the breakout buyers to get scared and sell. This sets up the pullback that you can get into with low risk, high odds, and a profitable reward.
Source:
http://www.swing-trade-stocks.com/pullbacks.html
Friday 18 November 2011
Sim +160 sideways
for less risk, take position after cross or near cross of EMA with indys rule intact
Thursday 17 November 2011
Wednesday 16 November 2011
Tuesday 15 November 2011
Sim -160 pre- market sideways
Side by side trading with Infinity Trading Challenge ---boredom before pit session open cause me to enter sim recklessly...found that my original setup making money if stricly adhered to :*(
however my losses was lesser than 1st Infinty trading Challenge..but they trade real money..and they are pros
however my losses was lesser than 1st Infinty trading Challenge..but they trade real money..and they are pros
Monday 14 November 2011
Friday 11 November 2011
Thursday 10 November 2011
Tuesday 8 November 2011
Sim test & Brain supplement
Okay...I need a warming up.
Decided that I put back 4 indicators there to take out stress out of my mind...
Feel good about this...seriously :)
And yes, my brain & health supplements arrived yesterday !.
Feel the difference already.. heheh
Decided that I put back 4 indicators there to take out stress out of my mind...
Feel good about this...seriously :)
And yes, my brain & health supplements arrived yesterday !.
Feel the difference already.. heheh
Wednesday 2 November 2011
MF Global - riskier than CL
<iframe width="560" height="315" src="http://www.youtube.com/embed/LtW-NJx5yT4" frameborder="0" allowfullscreen></iframe>
Wednesday 26 October 2011
Trading Challenge
If u guys want to see some real actions from the guru then klik this
http://www.livetradingchallenge.com/
and now I open for comments in this blog
http://www.livetradingchallenge.com/
and now I open for comments in this blog
Tuesday 11 October 2011
Need mental focus
The technique is okay ...but the problem is my mental focus...
May be I need a brain supplement :)
May be I need a brain supplement :)
Friday 7 October 2011
Simple mind
I look at the candles and it seems I can predict the next move like a trader ..for 2 consecutive days
Add in 1 indicator, then I begin to think more like a philosoper
And yet I have at least 2 indicators all this while.
May be my learning phase is over, and now its time to do it as a naked man ;)
p.s..ok I will SIM run naked for 1 more week.
Add in 1 indicator, then I begin to think more like a philosoper
And yet I have at least 2 indicators all this while.
May be my learning phase is over, and now its time to do it as a naked man ;)
p.s..ok I will SIM run naked for 1 more week.
Thursday 6 October 2011
Wednesday 5 October 2011
Stochastic
Price action is weak now so.... no action is required...
Back to indicators..sigh
I found that Stochastic work when it work.
With some weird behaviour, of course.
Yesterday I changed its MA to EMA..a sort of Dinapoli Stoch.
> Better.
MACD...yes...the old guy MACD.
I put the same parameter like D Stoch.
> No lag.
I lied...some lag
Will put some 'acid' to it. :)
Tuesday 4 October 2011
Monday 3 October 2011
Entry & Exit
Up to yesterday my system will signal me to enter and to exit.
Conflicting signals were abundant. 50: 50 , more so in current CL market
So it made me wonder, entry and exit surely have different dynamic behaviour
So I devised system A to enter and system B to exit so both will achieve at least 80:20
It is a logical move, right ?
We wanna the market move from A to B in our direction to make profit, right ?
As usual SIM test is good.
I will let it simmer in my trading mind
Friday 30 September 2011
Finding the right time frame
This post dated 25 Oct 2012, edited an old post
Every traders that worth their 'bloods' knew that market changed from time to time.
And the best pattern are useless when used in the wrong timeframe.
It is like a flower in the hand of the monkey..we all need good monkey.
So traders use MTF...but it didn't solved the problem.
It only solved if you use the right TF
But how to know which one is the one TF?
Use the Doji.
Yes, Doji is useless most of the time but,
Doji has a special place in the charts
If you look at the Doji... you'll be reminded it is the permanent pattern in the sniper's scope.
Don't laugh...see, I can read your mind.
Do you think I'm joking my friend...this is serious money at stake....
So when you read someone said he/she use NODoji, he/she is more akin a teacher than a trader.
What the meaning of a Doji ?
do the homework and you'll see what I meant I use the Doji to check the right TF.
I will not give the straight answer, but I'm not cruel...I gave you a clue to a hidden treasure.
I hope myself will not forget this post :) so I labelled it..this post will be lost after some time except to those who follows my blog :)
New scalping technique
well not really new , but I coincidently stumbled upon it after long dark hours...it is suitable for scalping.
for a more meaningful move I will learn more about Elliot wave
for a more meaningful move I will learn more about Elliot wave
Wednesday 28 September 2011
New technique in chart
I put an overlay study using a bigger chart into a smaller chart: Then I synchornize these 2 charts
Whoa...quite a view...no need to stretch my neck
Whoa...quite a view...no need to stretch my neck
Monday 26 September 2011

Saturday 24 September 2011
Divergence not suits to MIn charts
I revisited the donkey divergence lesson :
I found conclusive evidence that divergence is NOT suitable for MIN charts.
Thats all I have to say
I found conclusive evidence that divergence is NOT suitable for MIN charts.
Thats all I have to say
Wednesday 21 September 2011
Smurf vs Frakenstein
Due to EIA report, I decided just to watch.
My small account dont allow me to take risk, even though basically I'm right on technical. The market went long.
On day like this - news driven - no clear pattern found prior and after the news.
So I add ema synchronicity in my two charts for post-news period. Sim test green.
My small account dont allow me to take risk, even though basically I'm right on technical. The market went long.
On day like this - news driven - no clear pattern found prior and after the news.
So I add ema synchronicity in my two charts for post-news period. Sim test green.
Tuesday 20 September 2011
Started live session
but missed the move .
The visualization " patient & profitable" trader is good ...
Emotion : calm
Missed entry : Double bottom (to long)(read websites..duh)
Result : Nil
The visualization " patient & profitable" trader is good ...
Emotion : calm
Missed entry : Double bottom (to long)(read websites..duh)
Result : Nil
''Emotional'' journal
As trading involving emotional control. it is a wise move to record the emotional side of trading and compare it with the result.
Trading 1 > Emotion 1 > Result 1 (red -ve , green +ve , yellow) ( not in term of USD)
A trader's job is to trade or holding the trade
A trader's job is to trade or holding the trade
Monday 19 September 2011
Overtrade is the biggest Sin
Copy from:
http://www.elitetrader.com/vb/showthread.php?s=&threadid=125197
Given the limited number of traders who ultimately experience profitability, few other fields have more published rules and guidelines than trading. After all there's no book titled Idiots Guide To Trial Defense. We've been inundated for decades with the old saws about cutting losses quickly and letting winners run. Still we see little improvement in the trading performance of most participants. Futures trading is truly a zero sum game. Each night the Clearing House pays out the same amount of money it collects. Toss in commissions, charts, research and the endeavor quickly reaches negative expectancy. Since I began trading on the CBOT floor in 1982 much has changed. Electronic access, FIFO and lower commissions have vastly leveled the playing field between professionals and the rest of us. While technological advancements have made trading short term more appealing than a generation ago, in my view retail traders should consider trading less. In fact rather than enhancing returns and cutting risk most short term strategies only accentuate the losses associated with futures trading. Allow me to share with you some cautionary aspects and a bit of advice that could help you clear some preliminary hurdles.
Commissions: One of the least talked about advantages of being an Exchange member is ultra low commissions. I'll let you in on a dirty secret. The most legendary floor traders would have been net losers if they'd been paying the same commission schedule as you. In the larger financial products it was very typical for a floor trader to trade 1000 contracts a day in hopes of making just $1000 a day in profits. Superstar traders like Tom Baldwin would trade 20,000 lots on a busy day. I'd wager that many of you who've suffered grave drawdowns in your futures account are gross positive! Think about the paradox. Profitable trading yet net losses.
If your trading style is of a scalping nature I have a couple of suggestions. If you're trading more than several hundred contracts a day then lease an exchange membership. I won't go into the details here but for larger traders a seat will reduce your commissions and exchange fees dramatically. If you choose to remain at the retail level then try trading on an exchange or product with lower fees. Eurex charges far less than it's American counterparts. If you must scalp in America then look at lower fee markets like Treasuries. Or if you want to scalp a non-fixed income product choose a market with a larger minimum tick size. Paying $4-5 a r/t to scalp markets with a $5 tick is nonsensical. Cutting transaction costs is one of your most viable edges.
Short Term Technical Trading: I'm going to be both emphatic and controversial. There's is no system based on short term indicators generating anything other than real time random performance. It's utterly naive to believe the next few ticks can be handicapped by a stale set of variable equations. Now I know some of you are thinking I'm out of touch. That's because you've just successfully back tested some esoteric system with divergences, crossovers and filters. You're sure this new optimized system is gold. Think again. First the obvious. The Goldman's, Morgan's and big bucks CTA's with their vast computing power and impeccable tick data have already tested every conceivable indicator under the sun. Even if you're onto something remotely consistent you'll be subject to all the problems of high frequency short term trading such as commission costs, unable price orders and slippage. Now here's the good news. There's many signals derived from longer term strategies that will produce quality short term trades. Which signal has a more reliable chance of generating quick follow through? A new 5 minute high or a new monthly high? As a technician doesn't it make better sense to monitor a wider array of markets and spot higher percentage opportunities then to “specialize” in a single market and take a series of weak signals derived from noise?
Trade The News: One of the pretexts of technical analysis is the theory that news is already reflected in price. Nonsense. Markets are organic. Market moving institutional participants are constantly reevaluating their positions based on evolving perceptions of fundamental information. Think of the market as a basketball game. We're watching a half court offense methodically passing the ball around the perimeter in search of a high percentage shot. Suddenly an athletic defender intercepts the pass and runs down the court uncontested for a slam dunk. That defender's name is News and he can spoil even the most conservative game plan. News often comes unannounced. News can be as unreported as a dry weekend in July when perceptive traders figure out there's a potential drought developing and then push futures to a limit up open. No matter how mechanical and detached your approach you'll be frequently confronted by decidingly anti-technical factors.
Position Sizing: It only matters how much you bet. We've all made historic market calls only to take a small profit much too soon and then watch the market explode for weeks on end in the direction we anticipated Then the next time we try to milk a winning trade for just a bit more and see our open profit evaporate into loss. It seems that picking the markets direction is seemingly easier than extracting consistent profits. I preach two approaches. For folks who're reasonably well off and seeking stable returns I suggest you vastly under trade. Practice with scaling out of winners along with hard protective stops. Larger accounts should risk no more than 1-2% of their equity on each trade.
For smaller accounts I advocate a more wide open strategy. You're probably not going to double your account 12 consecutive times trading for 1 tick at a time. None of us are that good. What you can do however is hit an occasional home run. I'm not saying just let it rip without an uncle point but you must intelligently look for opportunities that'll give you a quantum leap in return. Unless you're still a teenager, compounding $5000 by 20% a year isn't going to be a life changing experience.
Learn About Options: Like futures themselves, options are increasingly traded electronically and have enjoyed tremendous surges in volume and liquidity. For small traders the ability to over leverage with a defined stop loss on equity is a boon to your big play potential. I'll give you a pertinent example. This past December I had strong resistance on the March e-mini S&P at 1511. I decided I wanted to risk $10,000 on a short position. Index futures margins would have allowed me to short just 2 contracts. A 100pt down move would in turn have resulted in a $10,000 profit ($50 per point x 2 contracts). Instead I bought $10,000 worth of put spreads with an expected 8-1 payoff if futures closed below 1400 at January expiration. Fortunately the trade worked and my 10k turned into a minor windfall of $80,000.
Another advantage to long premium options trades is the ability to trade futures positions contrary to your options. If you're long calls you can then be a natural seller of futures. Often if you're in a rhythm you'll quickly pay the cost of your options with the proceeds from your delta hedging.
Accept Your Psychological Shortcomings:We're all flawed in one way or another. Discretionary traders in particular are subject to the pitfalls of poor trade selection, over trading, undefined risk and revenge trading. A movie actor can vacillate between bi-polar feelings of arrogance and guilt but what makes his foibles different than a traders is the simple fact that he gets paid no matter what self destructive urges overtake him. Trading is akin to playing 18 at Augusta each day. We will never trade perfectly but must attempt to at least minimize our innately ruinous impulses. Keep a journal of your trades. Don't just mimic the information contained in your brokerage statement. Instead keep a log of how and what you felt emotionally about each trade. Like me you'll find there's commonalities with many of your losses. For instance if I fail to take a signal that would've resulted in a big winner I'll invariably take a sub-optimal trade next. Often I'll over trade it to boot. Doing nothing more than eliminating your “trouble spots” will save you money that can be dedicated to the next good setup you perceive.
Hopefully I'll have an opportunity to expand on these points in subsequent articles. Till then, best of trading and good health to all.
Thursday 15 September 2011
Closer and closer
Sim Trading - made paper money even though market ranging yeyy!...
Closer to the light but I have no active trading right now. My son sitting an important exam :)
Closer to the light but I have no active trading right now. My son sitting an important exam :)
Tuesday 6 September 2011
How to protect your trading mind
Once trade is entered, I would say wait for stop loss to be taken out OR IF YOU FEEL IT NOT GOOD, GO FLAT ASAP. I said this because trading is naturally risky and a losing business....If the trade proved to be good, then the trade now should be breakeven. Once the trade is profitable, bring the stop loss closer to make sure the profit is protected. Not only that, my TRADING MIND is protected from emotional worry. I can see and think clearly.
Thursday 25 August 2011
The Fibbemas and the gang
To repeat - What I need to trade succesfully:
Experience - such as yesterday - back to base is again showed in CL.
The lucky Fibbemas :he he :
5 , 9, 20, 50, 100 - Why I didnt follow the oldman's sequence you asked...Well, he didn't trade CL
Candle Pattern : Hammers, doji, engulfing, inside candle, wedge, covering
Lots of 3 point lines
Long Range Lines
Volume
Y - High,Y- Low, Y-Close
Trading Styles: Breakout in 4mins, Pullback and Continue 1 min, Bothways Triangle, 50% retracement, Observing Candle patterns.
Donchian Channels to be considered
Target 200 daily
After reviewing my trading in this holy month, I have a conclusive tool and edge now.
So I can moved to the next level of trading. I need to determine my min profit traget as I found that keep longer trading hour is bad for me.
So here my trade management plan:
No. of trades per day : remained 2 times per day
Profit target: USD 200 per day. If I got more from first trade, it will be a bonus. If I got less 200 from 1st trade, I will try the second trade.
Risk per trade : -USD 100 per trade, exit as wish - not waiting for Mr Stoploss once I found that the trade is bad. So at most it shall be breakeven.
Wednesday 24 August 2011
The long road to Succesful Trading
For a long time I have this Idea A that yet to be implemented due to lack of tool.
The I upgraded my Sierra Chart to the latest version.
Now I can put in the tool that I really want to use and discarded the usual ones.
Then yesterday I read this thread
Looked like that I have the same idea with Kiwi, a VERY senior trader and respected Indicators programmer.
Tuesday 23 August 2011
Be like Water - continue
Revised some tools in my chart to suit the market, especially the MA as it is quite tricky.
I also separated the MA from main chart in order to have a clear mind :-)
Add up a timer, as I acted to soon before the candle close.
I have a good feeling about my current chart layout
I also separated the MA from main chart in order to have a clear mind :-)
Add up a timer, as I acted to soon before the candle close.
I have a good feeling about my current chart layout
Monday 22 August 2011
Trading is truly is a mind game
I determined that there are at least 4 phases of CL, not as simple as 2 as I previously thought.
1) Straight trend - Breakout style
2) Waving trend - EMA style
3) Pulsing Trend - Price/Candle Pattern style
4) Ranging - Indicator style
The problem with my mind is that I need to clear my mind before I could see the phases. My mind want confirmation but the market is full of Uncertainty. Trading is truly is a mind game. To beat the market, I need to adapt to the market uncertainties, I need to be like Water
Thursday 18 August 2011
Still on sabbatical leave
Halfway through Ramadhan and I'm still on sabbatical leave.
This give me opportunity to re think strategies.
What I have now that I can predict only about 10% of CL behaviour.
The other 90% drive me nuts - the ranging period.
How you can plot your trading plan if the price is random ?
Traders said it's hard to predict the highest and the lowest.
I will focus how to determine that - the level of high and low and play pull back at SR
Wednesday 17 August 2011
Again, CL went to the starting base before jumping down
The market scaled higher and higher to the peak
Then I looked at 1chart, I saw the hammer and doji
the 3chart showed normal candle but with MACD divergence
My 50chart show contraction of bolingger.
I put SIM short . Walla - Quick SIM win 490.
Then I looked at 1chart, I saw the hammer and doji
the 3chart showed normal candle but with MACD divergence
My 50chart show contraction of bolingger.
I put SIM short . Walla - Quick SIM win 490.
Monday 15 August 2011
Learning a new trick
I learned fibonacci this week. It is simple in it application and whats more ..combined it with what I already know the it make some sense in my trading brain.
A definite good thing of fibs is that it helped me draw horizontal lines at one clik !
A definite good thing of fibs is that it helped me draw horizontal lines at one clik !
Wednesday 10 August 2011
Sunday 7 August 2011
Faster, and Stocks are tanking
In US and malaysia the stocks are tanking.
And I'm grateful that I can trade CL future as a better alternative.
Again, I re looked my old charts and I decided to change the slow stochastic to faster stochastic.
No body told me that except my fast brain.
p/s....Coincidently, Richard advice is relevant
http://richardwesleytodd.blogspot.com/2011/08/hahahahaha.html
Thursday 4 August 2011
Master and slave charts
SIM -Previous weeks I'm simming mindlessly... I got -ve result, but yesterday i got positive results. Good improvement for my self and I felt comfortable.
This is the last set up that I will not changed any more as I have tested it mindlessly like a zombie. For the record I had nearly 900 setups within 3 years trading part-time. I named it the NakedHammer ..He he he.
However I will try add up a range chart to have a micro look for the trend...but this micro chart is not a decision maker master chart, it is more like a slave chart
Wednesday 3 August 2011
Tuesday 2 August 2011
So easy on SIMMING
For about a year I watch CL in 2 min frame.
They said don't changed your set up. Yeap I followed that advice. 1 year.
Yesterday I watch CL in 1 min frame.Totally focused. Interesting.
(5min and 15min charts as the GPS)
.
Now I understand why 2 min frame is different compared to 1 min frame.
It's the time, Elliot Wade..
he he.
Again CL went to the base.
SIM trade - usd 650...more than 1 plays, of course. It is so easy when I'm SIMMING.
May be I need to train my mind that my live is Sim and my Sim is Live
Monday 1 August 2011
Way To Go
SIM - This session the CL repeating its die-hard behaviour . It confirmed my CL theory.
Go to the base and jump : Jump up or jump down.
So my WTG
1) identify the base first - starting line, normally at the Pivots and SR
2) check the space of least resistance - direction
3) look for the pattern - the trigger - 2 types - the price pattern esp triangle , the candle esp hammer (pin bar), bigger candle and doji (spinning top)
4) My Stop Manager will deal with my losses , so I will concentrate only on the profits.
5) I may use stop order and market order where necessary
6) Special obs: Turnaround : After a long trend or long candle, usually followed by a hammer, a candle (various types) then price cross the line of dojis. Enter at the correct side of dojis lines.
Disclaimer : Foooollow at your own risk. You may have the knowledge but you dont have the xperience to deal with my set up.
Subscribe to:
Posts (Atom)